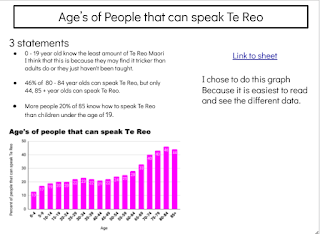
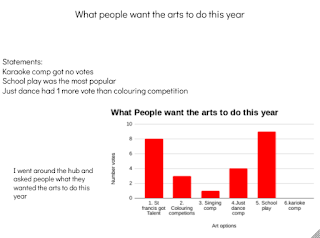
Hello, welcome to my blog. This week for Maths the goals were complete a statistical investigation by collecting, displaying and discussing data, determine appropriate variables and data collection methods. Choose an appropriate data display. Analyse a data sample.use a database (spreadsheet) to collect and organise data. Evaluate findings and form conclusions. We had to collect data and then make a graph with statments about our data. Our data had to have something to do with New Zealand. I did ages of people that can speak Te reo. I got the data from the teacher which they found on google. And then In Target math we had to a graph about soemthing else. I did mine about what everyone wants the arts (My leadership group) to do this year. I went around the hub and asked people what they wanted the arts to do this year. Here are my Graphs:
Here is the first 1:


